 How it works
Material Monitor tracks Quarry and Mine Conveyors and reports Product Movement, Productivity and Downtime
This complete conveyor and product movement tracking system provides detailed reports about product movement, equipment downtime and plant efficiency. Get ACCURATE production and product movement readings - with starts and stops - without the labor cost or human error. Reports include: Realtime operating conditions, production movement, Reports by Product, Date Range, Offloads and Loadouts, Downtime by Date Range / Equipment / Type of breakdown. An Industrial hardened tablet allows Operator entry of Product being moved, Barge/Truck ID, downtime reason from picklist and comments. Reports are easily viewed on site, or by remote management in a browser on a Desktop, Tablet, or Smartphone. A few Sample Reports are available at the bottom of this page.
You can know how much product you are processing each day by add a communicating scale and MatMonitor™. Know when the product starts, slows, and stops. Detailed reports show the mine/quarry/plant productivity, including downtime times and reasons.
Get the weight of aggregate material on or offloaded from barges. Instead of manually measuring the barge height using "boots on the barge", MatMonitor™ will record each on or offload weight, time of day, and - the operator can enter the barge ID and company name. Don't count on a stick or tape measure to invoice customers or know how much material you just bought or sold.
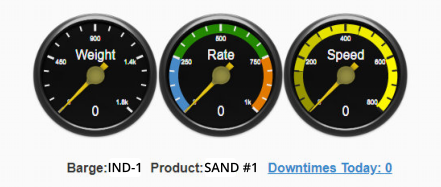
Use the Quicklook Dashboard to monitor production from near or afar. The near realtime "Quicklook" Dashboard shows Weight, Rate and Conveyor Speed in text and on a gauge for each scale. Daily/Weekly reports and graphs show K.P.I (Key Performance Indicator) figures such as production, product movement, slowtime, and downtime duration and reason. Historical reports allow ad-hoc "any dates" reports for any time period.
Weight and Production Data is automatically checked and corrected for "data jumps" and illegal/impossible changes in weight. In addition, internet and data connection failures are recovered automatically at the rate of 20 to 30 minutes of data per minute, while continuing to post realtime data. Daily statistics of errors and corrections are stored for review and management and IT/Infrastructure team members can review on-screen reports as part of CMMS (Computerized Maintenance Management System) preventative maintainance measures.
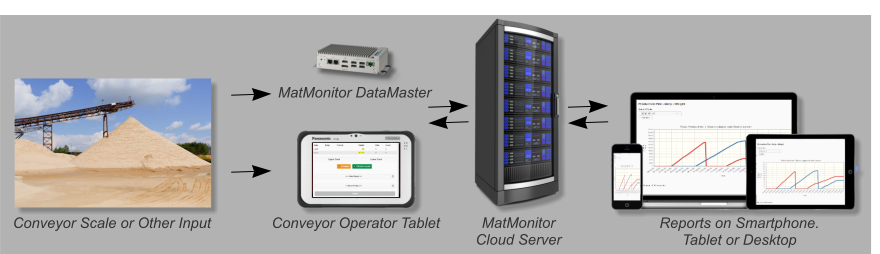
Automatic Data Recording of Conveyor and Product Movement. Connect MatMonitor™ via ethernet to your pollable belt scale for a complete recording and reporting system.
Real-time overview of products, weight processed, conveyor speed, and downtime events — from on or off the plant. One panel per scale/device monitored. Custom configurations available.
• Daily/Weekly/Quarterly Tonnage by Product
• Quarry/Mine Material Transfer
• Barge Load and Unload
• KPI (Key Performance Indicators)
• Downtime Times and Operator Entered Reasons
See Sample Reports below
An industrial touchscreen tablet allows reliable data entry. Operators can enter Material being processed, Barge and/or Truck Load Identity. Downtime Reason (from picklist and comments). Custom Fields may be added per needs.
You don't need to be on-site. Reports are available on a "need to know" basis, per the role in the company. Operators, Managers and Owners all have different security roles and see different level reports. In addition, there is site lockout control: 1. Site Only 2. All Company Site/Offices 3. Anywhere.
MatMonitor™ is modular, supporting multiple data collection device types, reports, exceptions, display and report formats. The system is capable of providing detail at many levels to support corporate reporting needs. Contact us with your requirements.
❝ Don has developed a first class tracking system to track the variety of materials that
we offload from barges and place into resale and production inventory. We are now able to track,
with a couple clicks of a mouse, tonnages of product, by product, by the day, week, month, quarter
or year. Incredibly quick, visually easy, and extremely simple to navigate. I am able to monitor
real time to see what is happening at multiple locations, faster than making a phone call.
Any time that I have had a question or request, Don has responded quickly, and accurately with a
response or a solution. ❞
David Payne Yager Materials Limestone - Aggregates
All Testimonials
(click)
1. AUTOMATED DATA COLLECTION
The on-site store and forward appliance polls your scale once a minute and sends the
weight, belt speed, etc to the MatMonitor™ server. Should an internet connection fail, auto-recovery will insure
data is tranferred. We have had outages outside of our control of over a week, and all data was succesfully recorded.
If your measuring device communicates via any electronic protocol, contact us.
2. OPERATOR DATA ENTRY - Optional
Operators can use an industrial hardened tablet to enter product, barge, downtimes reasons, etc.
The custom tablet screen will allow the operator to augment your specific material flow and process steps.
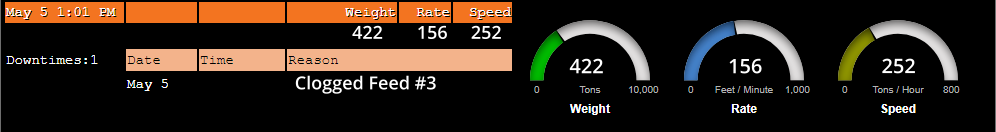
3. REAL-TIME STATUS DISPLAY
Management real-time status displays show product movement, downtimes at each conveyor.
This may be monitored remotely via secured manager/owner login.
4. MANAGER / OWNER REPORTS
Operators and managers login using a smartphone, tablet or desktop. Real-time and historical reports always available.
Multi-level security controls user access and differentiates local from remote Manager/Owner access.
Here are just a few report examples that show product movement, productivity, downtimes and activity. MatMonitor™ allows adding specific custom reports per your specifications.
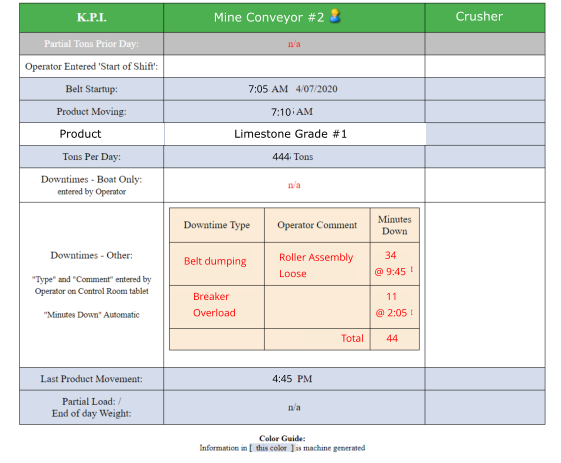
MatMonitor™ automatically captures and reports Key Performance Indicators (KPI).
This display is used in two different ways: 1. real-time, 2. any prior day.
- BELT STARTUP: When belt first starts moving
- PRODUCT MOVING: When product first starts moving
- PRODUCT: If entered by Operator on an Industrial Tablet
- TONS PER DAY: Calculated by MatMonitor™ and displayed real-time
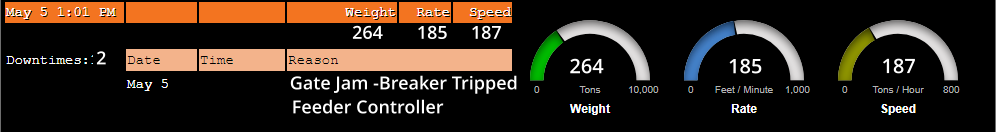
- DOWNTIME TIMES: When they Stop, WHY and for how long
- DOWNTIME REASONS: Operator entered Downtime reasons on tablet
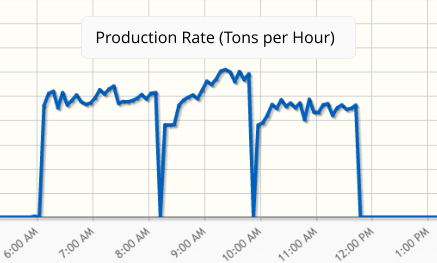
The "Production rate" graph shows the "Tons per hour" over the course of the day. Runtime vs. Downtimes can be seen at glance. This is just one example, and we are also happy to create specific reports per your needs.
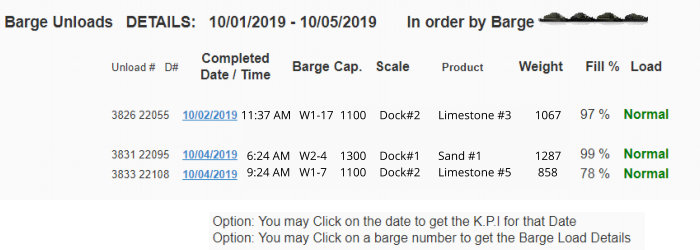
The Barge Report shows Barge offloads that have run across a conveyor. NOTE: For detailed analysis, this report can be selected for any date range, and shown in 3 different sort orders: by Date, by Barge, and by Product. You can also select to show only one product. If the barge load meets the target percentage, they are flagged Normal and shown "Green". Exceptions are easily spotted in Yellow or Red - this is a "Loading to Capacity Report Card" to flag exceptions and encourage employees to load barges fully.
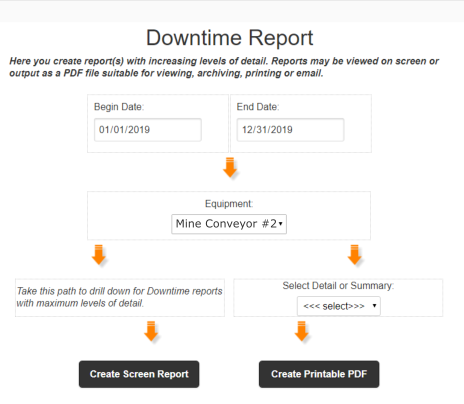
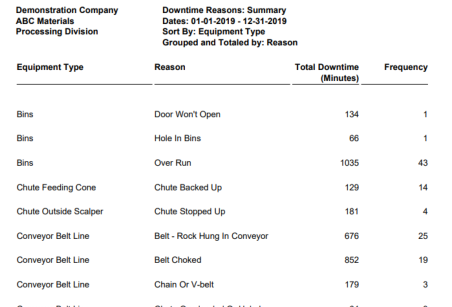
The system automatically detects and logs each Downtime event duration without Operator action. If the Operator selects a Downtime Reason from a picklist, and optionally enters a comment, that will also be recorded. Management can run reports and drill down: summary, detail, frequency - for any time period, with varying sort orders. This is a very useful tool to find and concentrate effort on repeat problems.
MatMonitor™ is a mature system that has been in use for over 9 years at multiple locations . The above is only a sample of available reports. If you need more reports, or raw or cooked data feeds for your internal corporate reporting system, feel free to contact us with your specific monitoring and reporting needs.